ggplot2 Grammar
Ming Chen
6/25/2017
The grammar of ggplot2 plots
The following ggplot template comes from the book R for Data Science by Garrett Grolemund & Hadley Wickham.
ggplot(data = <DATA>) +
  <GEOM_FUNCTION>(
     mapping = aes(<MAPPINGS>),
     stat = <STAT>,
     position = <POSITION>
  ) +
  <COORDINATE_FUNCTION> +
  <FACET_FUNCTION>
Each ggplot2 plot is a combination use of seven parameters as you can in the template.
DATA: contains values presented on a plot.MAPPINGS: determines how values are mapped to plot elements.STAT: the rule of transforming original values to new values and then mapping new values to plot elements.POSITION: arranges locations of observations presented on a plot.COORDINATE_FUNCTION: provides several different coordinate systems.FACET_FUNCTION: split plot into facets.
Examples
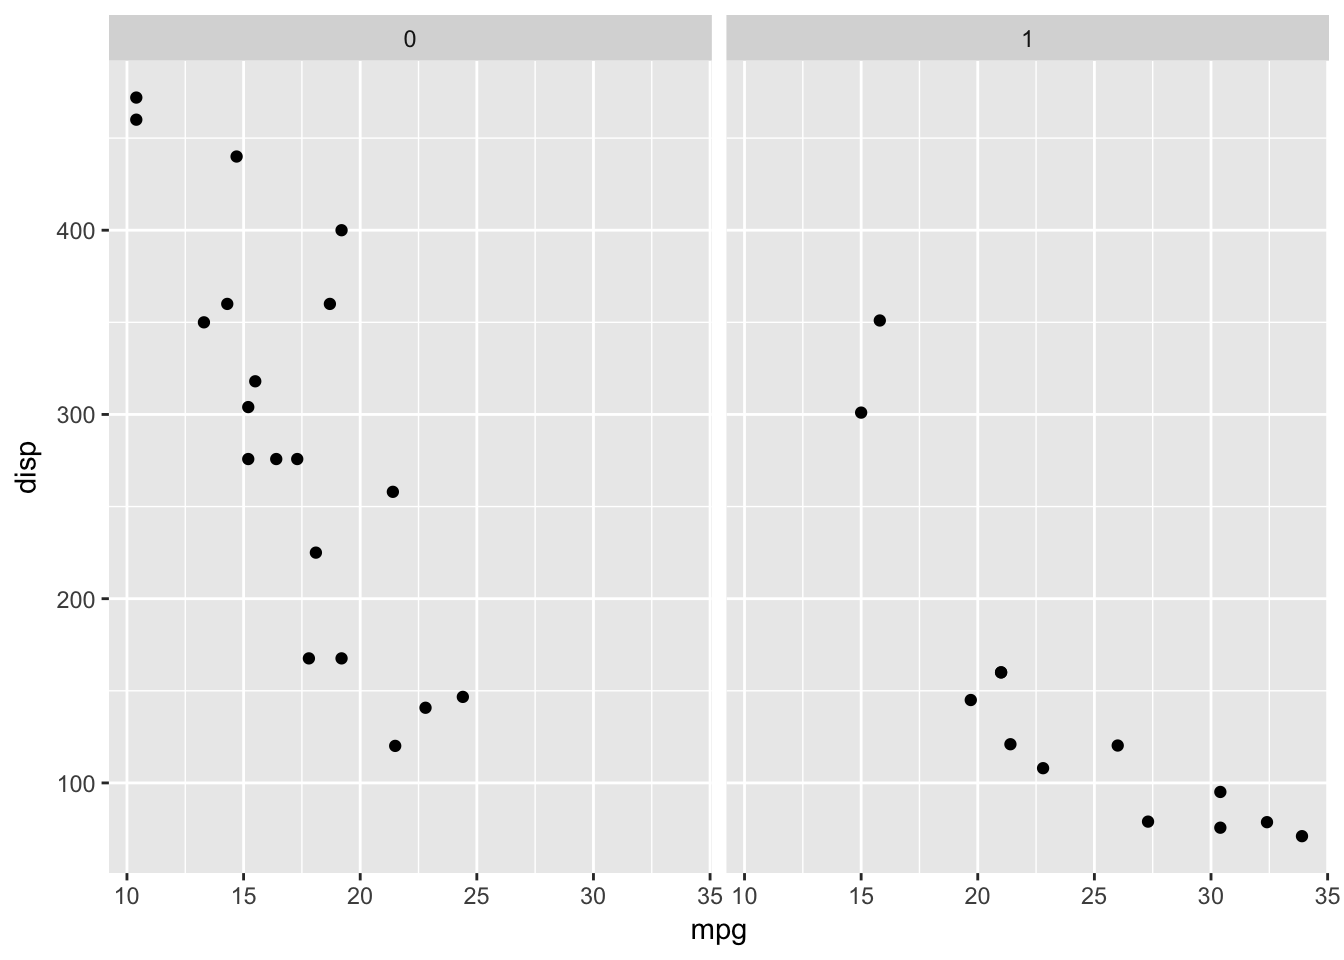
ggplot(data = mtcars) +
  geom_point(mapping = aes(x = mpg, y = disp),
             stat = 'identity',
             position = 'identity') +
  coord_cartesian() +
  facet_grid(~am)