Plotting Symbols
Ming Chen
6/24/2017
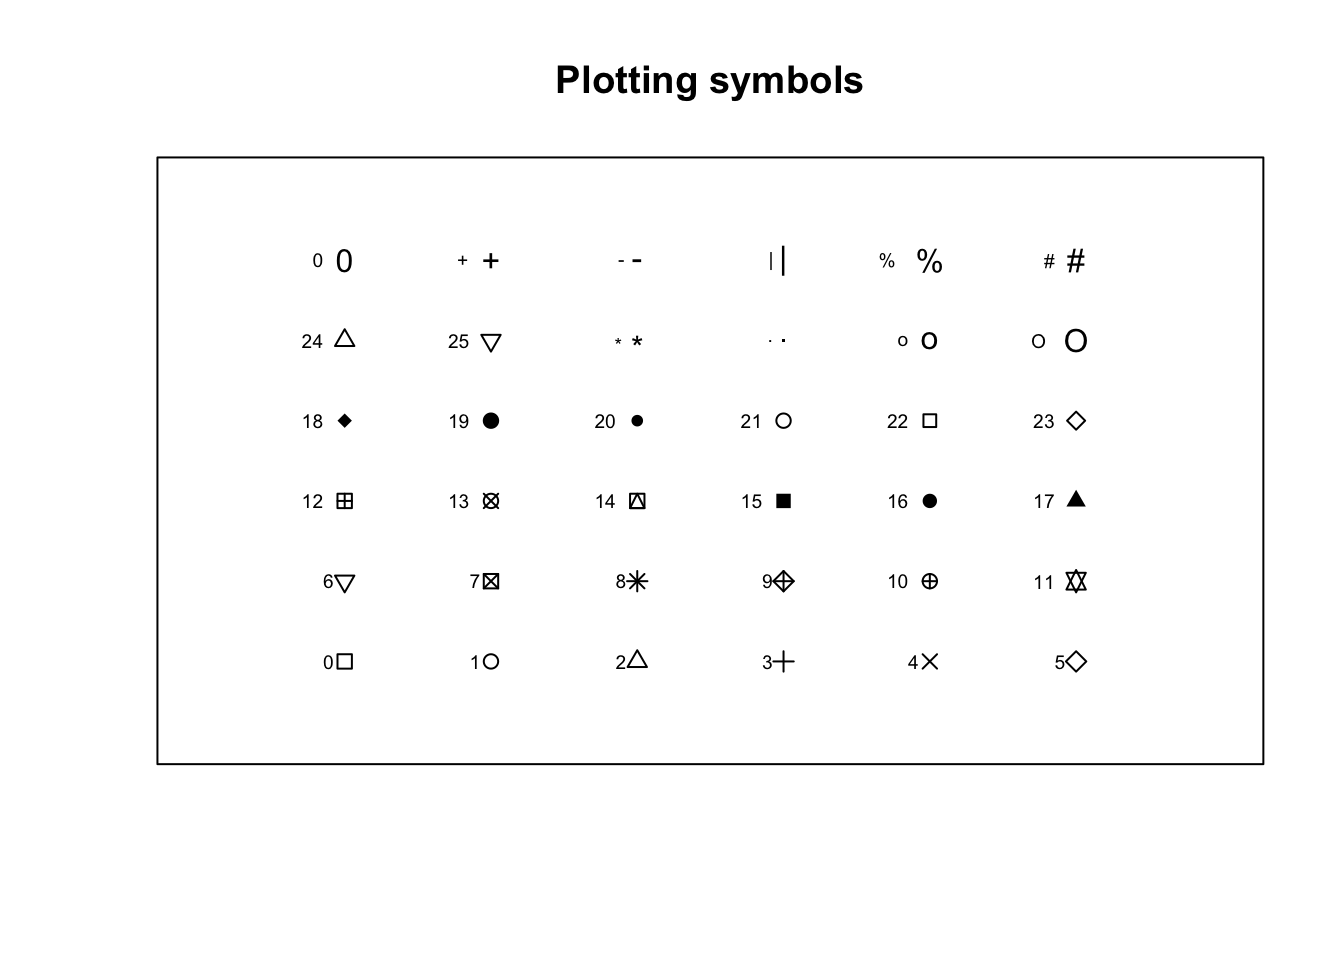
The plotting symbols is controlled by the parameter pch.
x = c(rep(1:6, times=4), 1, 2)
y = c(rep(1:4, each=6), 5, 5)
plot(x,y, xlim = c(0,7), ylim = c(0,7),
     pch=0:25, xaxt='n', yaxt='n',
     xlab = '', ylab = '', main = 'Plotting symbols')
text(x, y, labels = 0:25, adj=2, cex = 0.6)

x1 = c(3:6, 1:6)
y1 = c(5,5,5,5, rep(6, 6))
pch = c('*', '.', 'o', 'O', '0', '+', '-', '|', '%', '#')
points(x1, y1, pch=pch)
text(x1, y1, labels = pch, adj = 3, cex = 0.6)