Multiple plots
Ming Chen
6/24/2017
Multiple plots
mfrowmfcol
par(mfrow=c(3,1))
plot(mtcars$mpg~mtcars$disp, main="plot 1")
hist(mtcars$disp, main="plot 2")
boxplot(mtcars$mpg~mtcars$am, main="plot 3")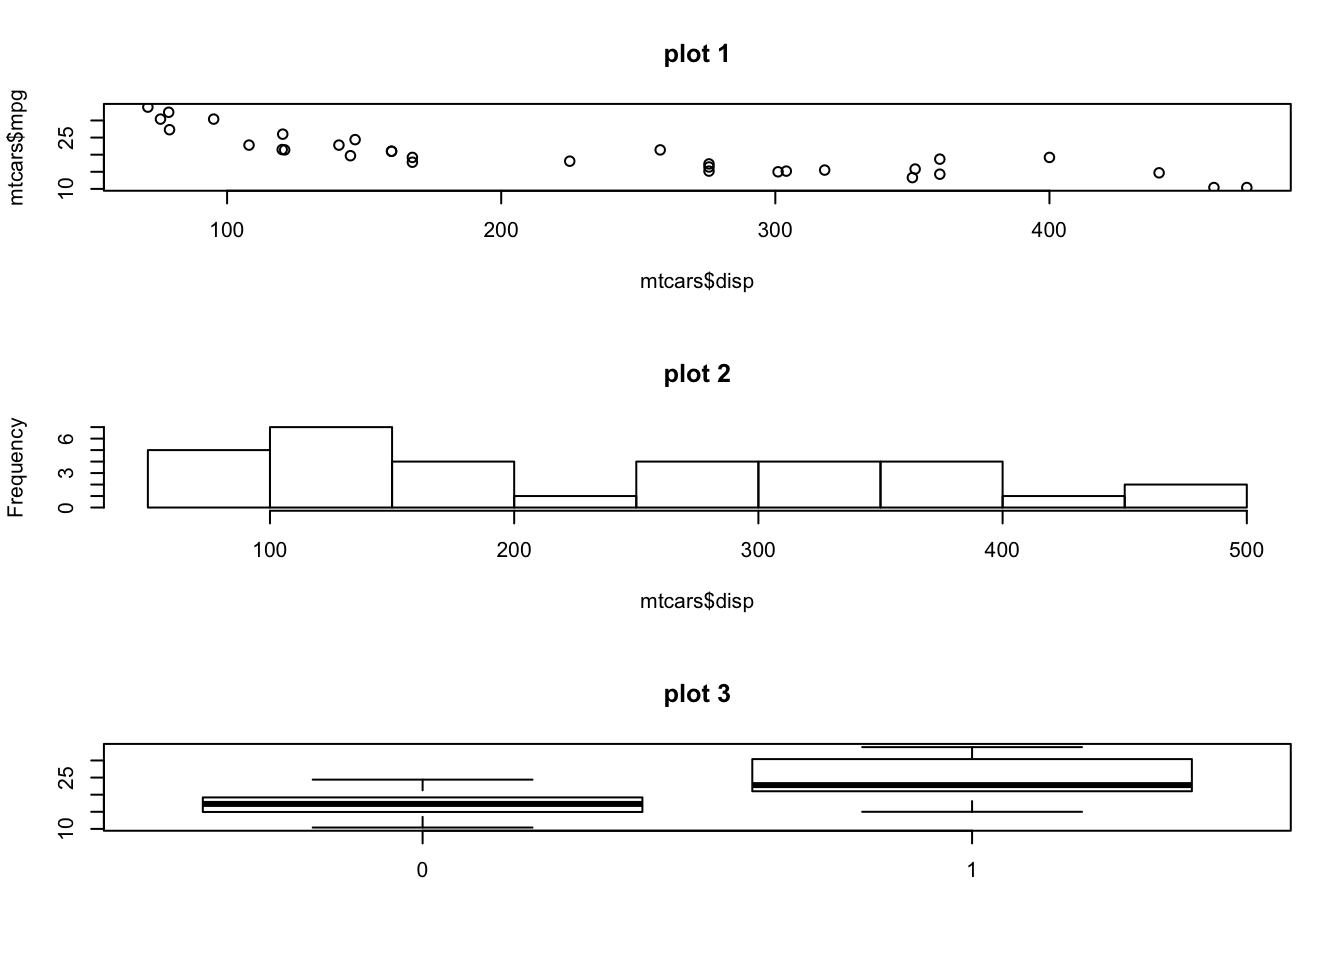
par(mfcol=c(1,3))
plot(mtcars$mpg~mtcars$disp, main="plot 1")
hist(mtcars$disp, main="plot 2")
boxplot(mtcars$mpg~mtcars$am, main="plot 3")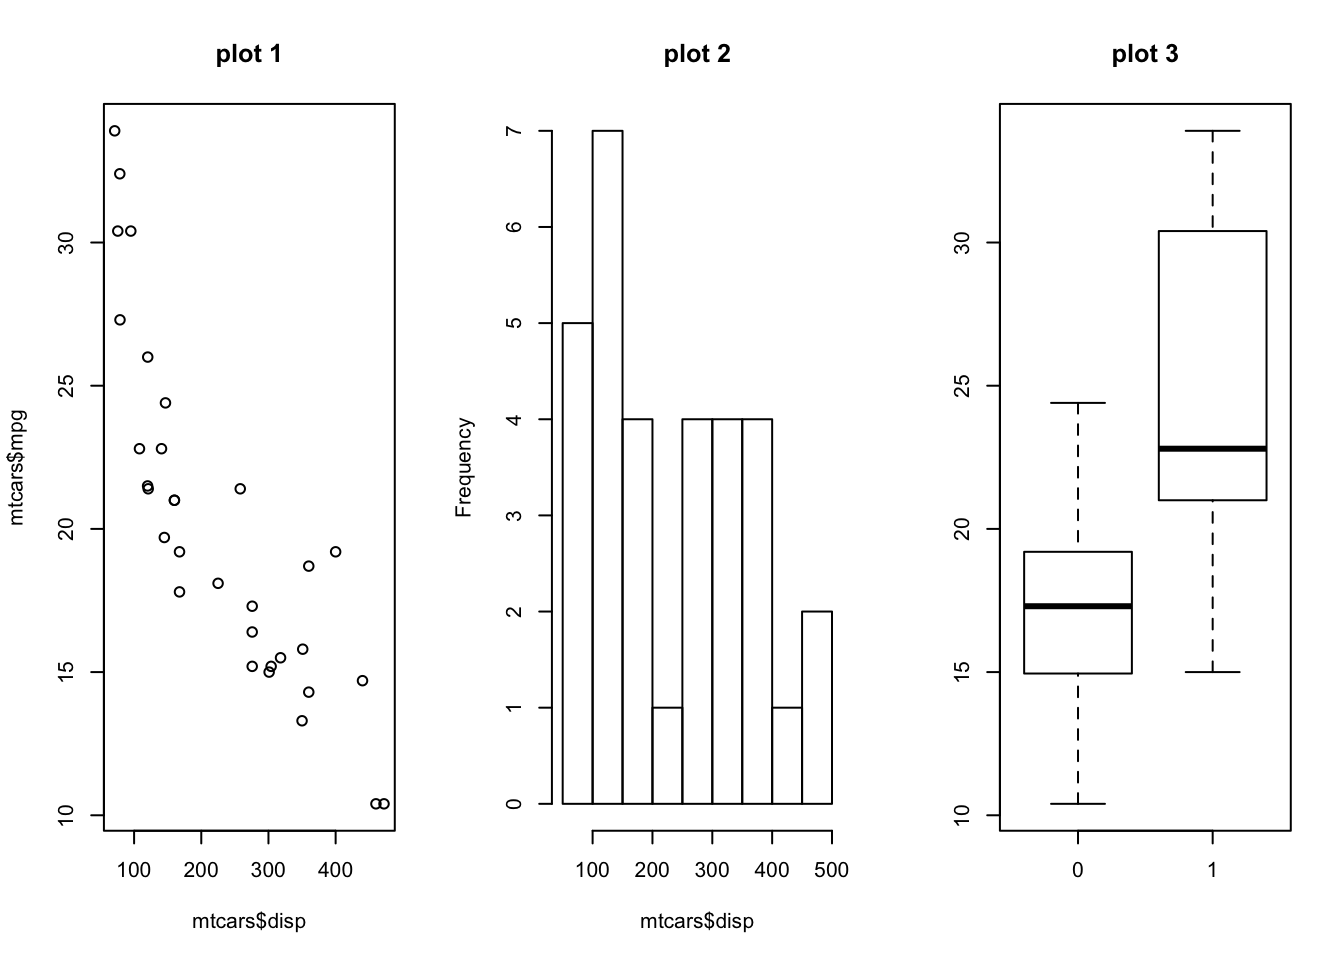
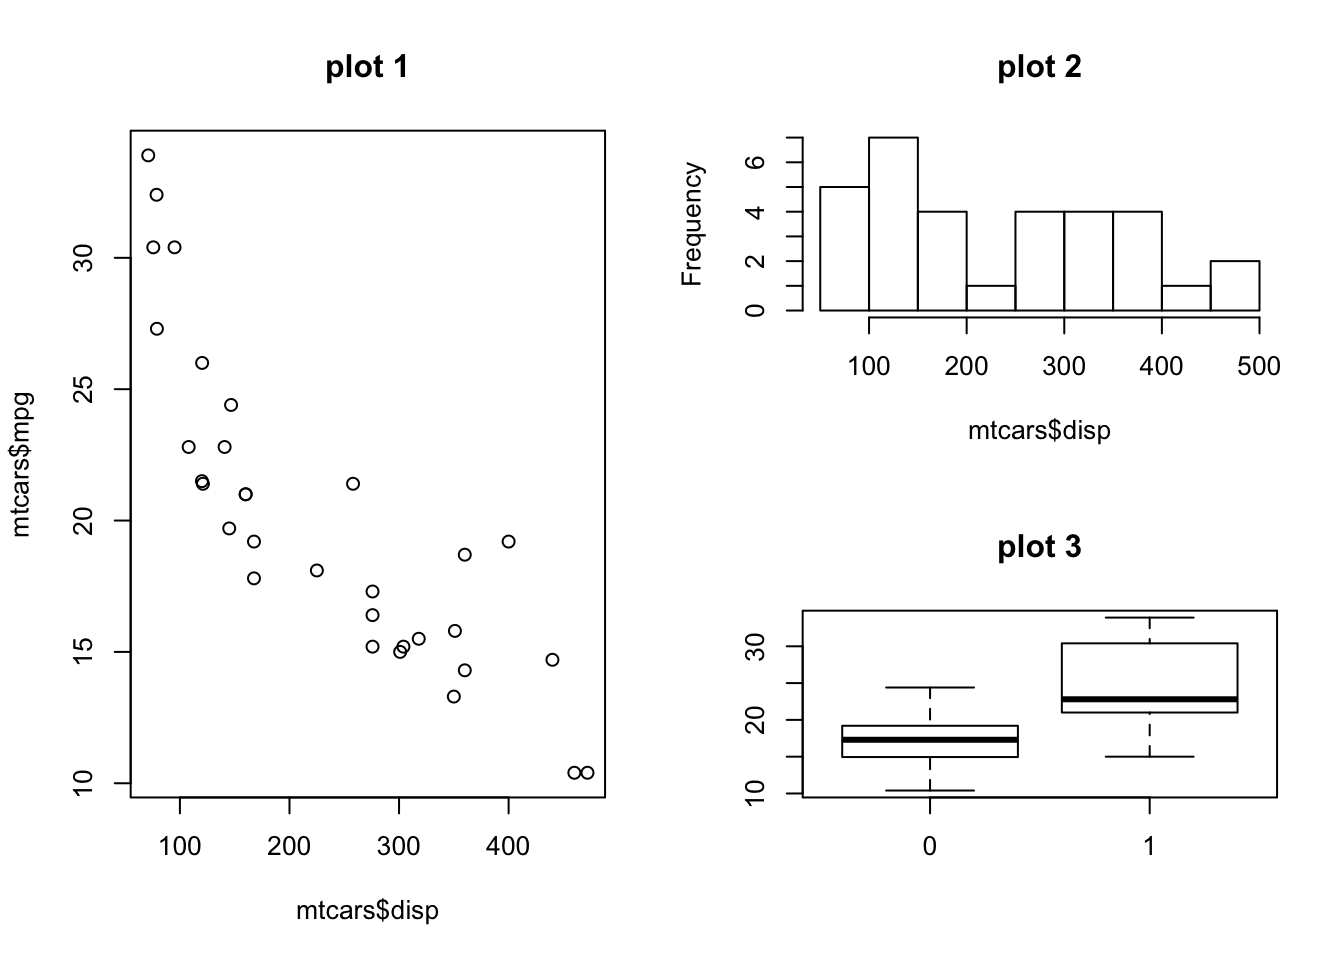
Merge plot areas
layout
mat = matrix(c(1,1,2,3), nrow=2, byrow=FALSE)
mat
## [,1] [,2]
## [1,] 1 2
## [2,] 1 3The numbers in the matrix define the plotting areas for each plot.
layout(mat = mat)
plot(mtcars$mpg~mtcars$disp, main="plot 1")
hist(mtcars$disp, main="plot 2")
boxplot(mtcars$mpg~mtcars$am, main="plot 3")